
Dashboard
Run your supplier contracts from a single dashboard
How many contracts fall due this quarter? Which supplier weighs the most? Which site spends the most? The answers fit on one screen, kept up to date on their own.
- Live indicators
- By site or supplier
- Upcoming deadlines
- Consolidated spend
You cannot steer what you cannot see
Most businesses know where their contracts are. Very few know what they add up to at any given moment.
Supplier contracts live in folders, inboxes and spreadsheets kept by different people. Taken one by one, each of those is accurate. The trouble starts with a cross-cutting question: what is the total committed for the year? How many contracts roll over automatically within sixty days? What share of the spend goes to a single provider? Rebuilding the answer takes half a day every time — so the question stops being asked, and decisions get made on gut feel.
The data exists but sits scattered
Ten accurate sources do not make one view. They make ten consolidations to redo.
The number always arrives too late
By the time the consolidation is ready, the decision has been taken.
Every role looks elsewhere
Finance wants amounts, operations wants deadlines. One table cannot serve both.
What the dashboard gives you
Indicators built on your real data, not on a parallel entry you have to keep up to date.
-
Statuses at a glance
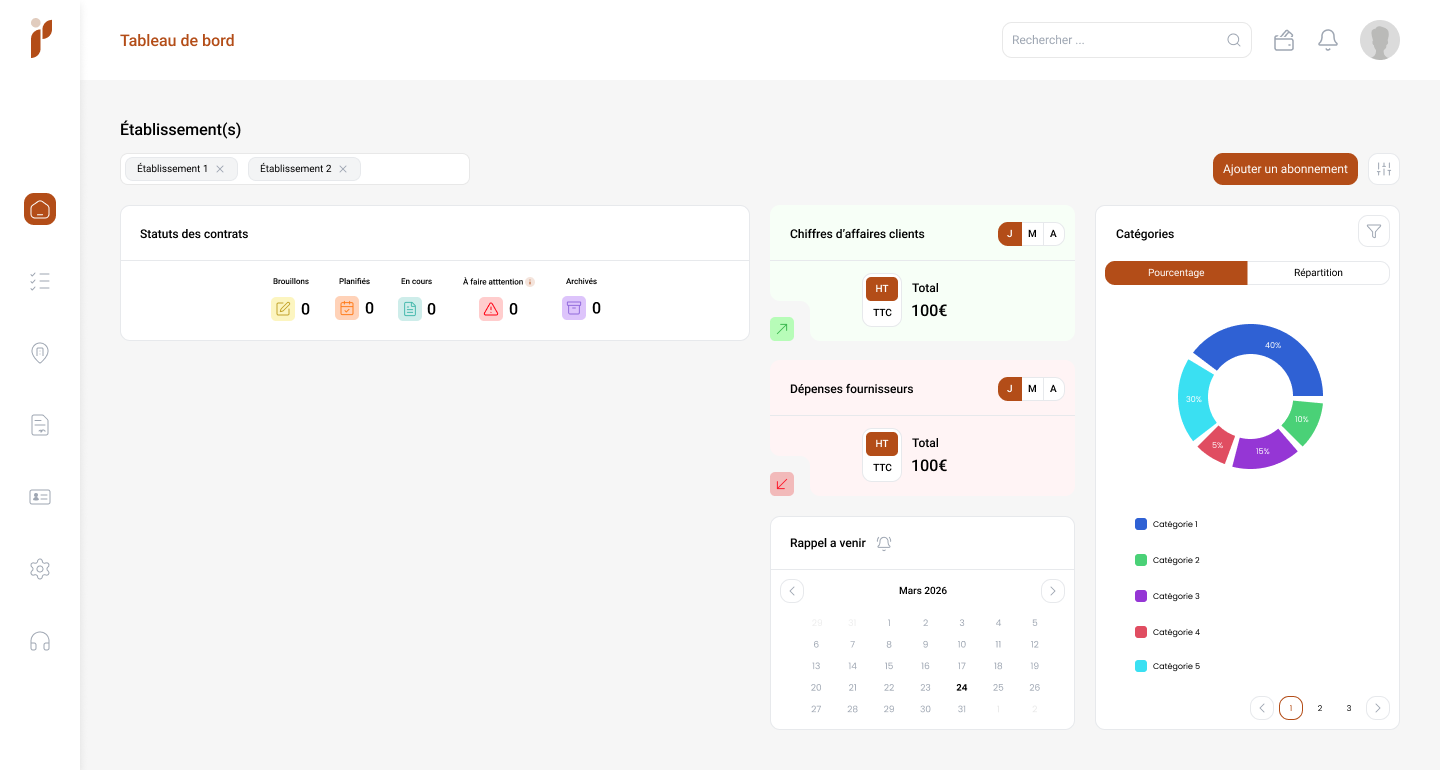
Drafts, planned, in progress, needs attention, archived: the volume of each status is always on screen and clickable down to the detail.
-
Consolidated supplier spend
Amounts excluding and including tax, by period, across all sites or one at a time, compared with the previous period.
-
The category breakdown
Maintenance, energy, telecoms, leasing, insurance: each line’s share of the total, so concentrations stand out.
-
Upcoming reminders
A calendar of the coming weeks sits on the home screen, so no notice period slips past unnoticed.
-
One dashboard per role
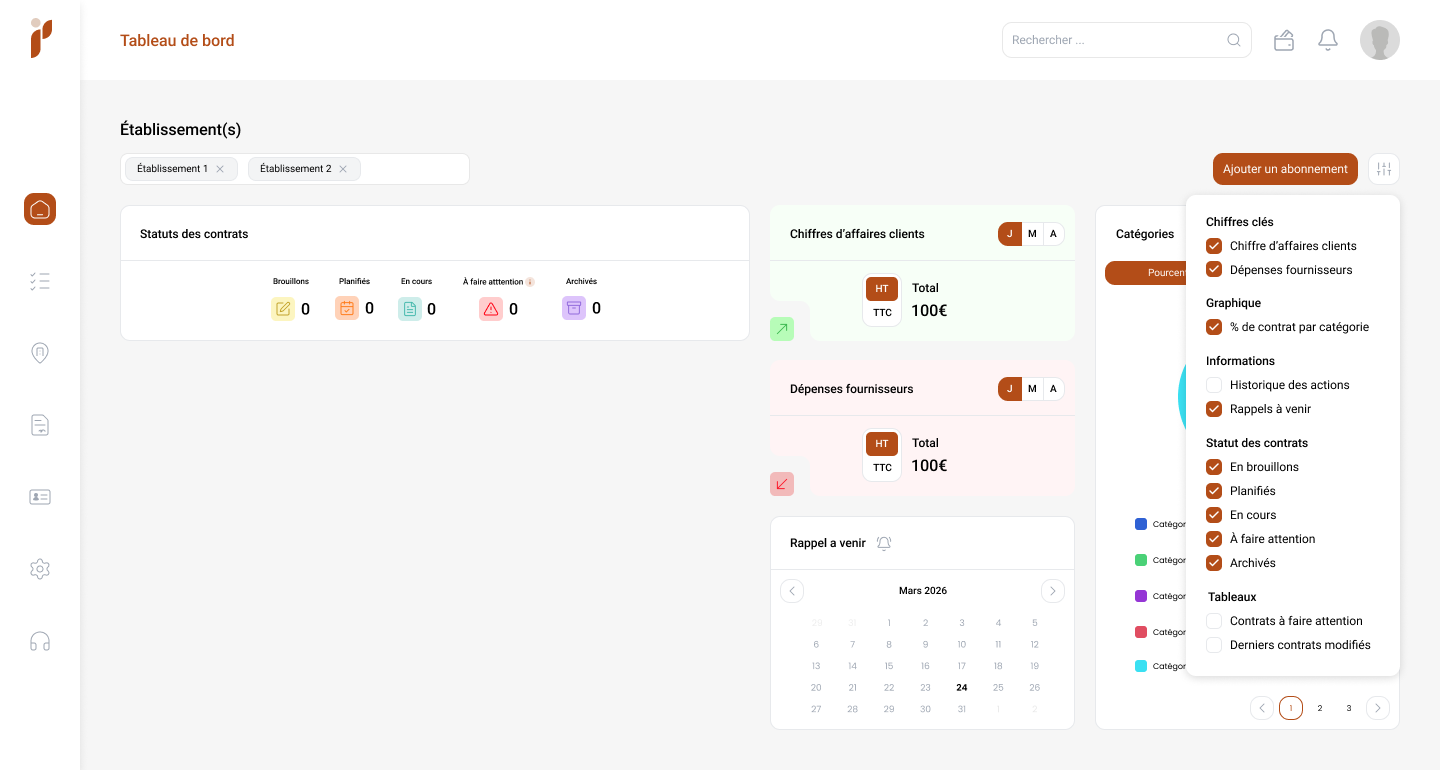
Widgets move, hide and reorder. Each user assembles the view that matches their job.
-
The site filter
A selector at the top switches from the group view to a single site, without changing page.
How you get to that dashboard
The dashboard is not a module to configure: it fills itself as the repository takes shape.
-
You add your contracts
Each supplier contract or subscription is created with its provider, its site, its amounts and its key dates.
-
The data feeds the counters
From creation, the contract enters the statuses, the consolidated spend and the deadline calendar. Nothing is typed twice.
-
You compose your view
You move the widgets, hide the ones you do not use and keep the indicators of your role in front.
-
You filter to fit the question
By site, supplier, category or period: the dashboard recalculates on every filter.
-
You share one reading
The same figures serve the board meeting, the annual review and the conversations with suppliers.
What you gain
An immediate answer. Board questions get answered during the meeting, not the week after.
No more manual consolidation. The time spent merging spreadsheets disappears, and the copy errors with it.
Drift spotted early. A category rising or a supplier concentrating shows up before it hits the budget.
A shared language. Operations, finance and management read the same figures, built the same way.
Frequently asked questions
Does the dashboard update itself?
Yes. It reads the contracts and subscriptions held in Pilboard directly, so every creation, change or archiving is reflected immediately in the counters, the amounts and the deadline calendar. There is no parallel entry to maintain.
Can the dashboard differ from one user to another?
Yes. Widgets reorder and hide per user. A finance director can bring amounts and the category split forward, while a site manager keeps deadlines and contracts to watch.
How do I switch from the group view to one site?
A site selector sits at the top of the dashboard. It filters every widget at once, without changing page or losing the layout you chose.
Which indicators matter most?
Three are enough to start: the number of contracts falling due within ninety days, supplier spend by period against the previous one, and the category breakdown. The rest earns its place case by case.
Are amounts shown excluding or including tax?
Both. Every spend block shows the amount excluding tax and the amount including tax, so management control and operations each read the figure they need.
Do I need to import history for the dashboard to be useful?
No. It becomes usable as soon as active contracts are entered. History enriches the period comparisons, but it can be added gradually without holding up the rollout.
Explore further
A dashboard is a means, not an end. Here is what it connects to.
See your own dashboard
Thirty minutes is enough to show you what your contracts would look like in Pilboard, with your categories and your sites.